
Conversational analytics for business teams
AI business intelligence for your database questions
AskYourDatabase helps teams ask business questions in plain English, explore connected database results and create charts. Use conversation for follow-up analysis and Dashboard Builder for repeatable views, with your data owner checking definitions and access.
For a private deployment or team evaluation, discuss your requirements.
Where conversational BI fits
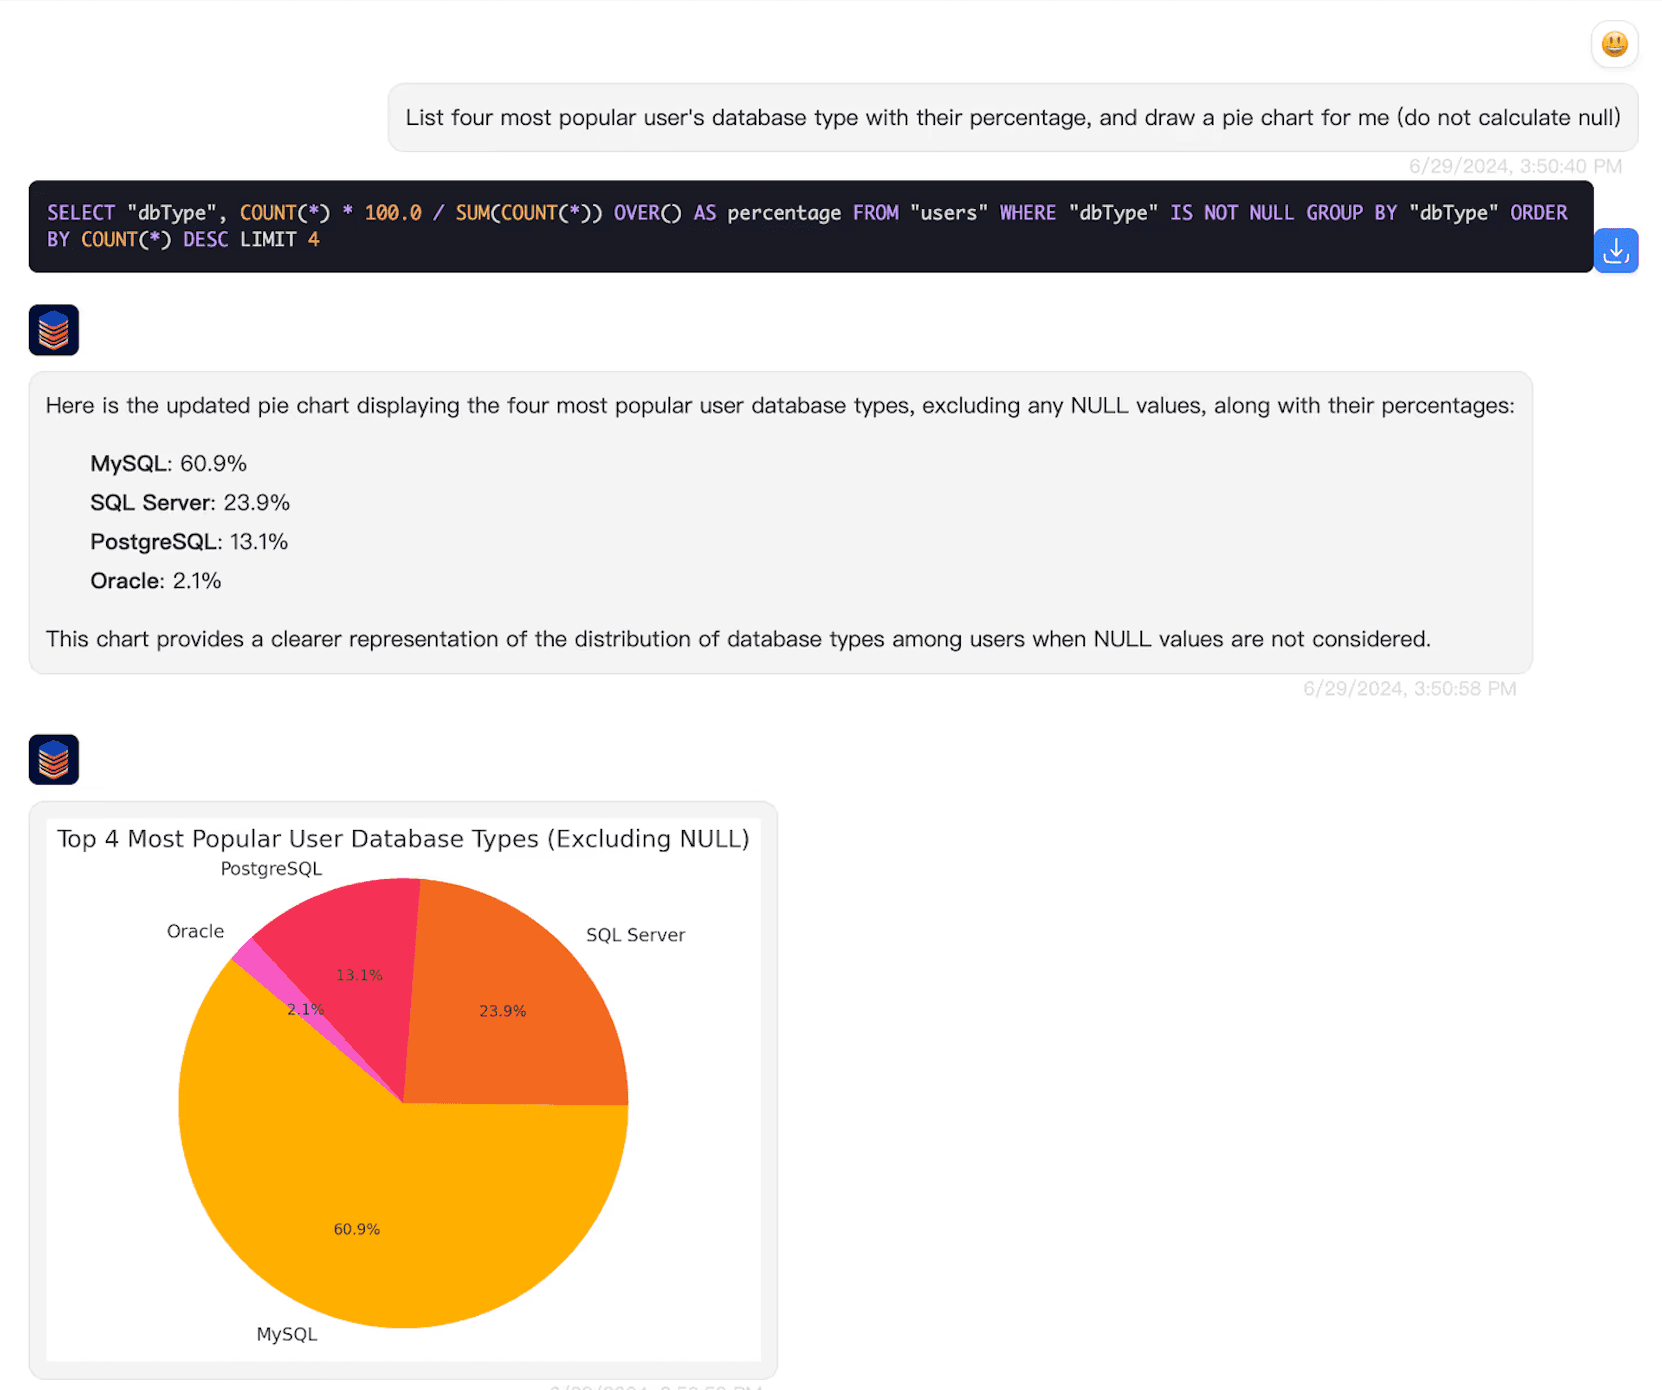
AI business intelligence can help people explore data through questions, generated queries and visual explanations. It is most useful when a team already has trustworthy reporting data but needs to investigate questions that a fixed dashboard does not answer. AskYourDatabase connects to supported sources; it does not automatically clean data, reconcile business definitions or establish causation.
| Your job | A useful starting point | What to verify |
|---|---|---|
| Ask a new question and refine it in conversation | AskYourDatabase Desktop with approved reporting data | The metric, result, date range and follow-up scope agree |
| Track the same KPIs each week | Dashboard Builder or your established BI report | Cards, charts and filters use the same definitions |
| Explore certified reports and an existing semantic model | Evaluate the AI experience in your current BI platform | Existing measures, access rules and distribution requirements remain effective |
| Let customers ask about their own records | Website Chatbot and an authenticated embedding design | Real backend identity and data restrictions, including negative tests |
For specific product choices, read the alternatives comparison. For customer-facing use, start with embedded analytics. Neither a chat window nor a chart alone establishes that a product meets your reporting and governance requirements.
If Power BI already owns your business measures, compare its native workflow before rebuilding them. Microsoft's model preparation guidance describes field descriptions, verified answers and AI instructions, including preview features. AskYourDatabase documentation and SQL examples provide context for its own workflow; they are not an automatic import of a Power BI semantic model.
A business question with a checkable answer
A sales manager asks: “For tenant A, show paid USD orders placed September 1–4, 2026, net of refunds recorded before September 5. Break the total down by region.” This specifies the business definition before requesting a chart. An analyst should first confirm that these are the right dates and refund rules for the decision.
The following figures come from the synthetic SQL dashboard worked example. They are a reference answer, not a recorded AI response or a customer result.
| Region | Paid orders | Net sales |
|---|---|---|
| North | 3 | $225.00 |
| South | 1 | $54.00 |
| Total | 4 | $279.00 |
The overall average is $279 ÷ 4 = $69.75 per order. Averaging the two regional averages ($75 and $54) would give $64.50 and answer a different question. The reference excludes cancelled orders, another currency, another tenant and orders outside the period; refunds are aggregated per order before joining so repeated refunds do not duplicate sales.
Next ask: “Show the daily breakdown, keeping the same filters and refund cutoff.” The reference totals are $105, $134, $40 and $0 for September 1–4. A chart should preserve the zero-sales day and reconcile to $279. Ask the analyst to check both the result and the query or execution record available in your chosen product workflow; do not assume every end-user chat exposes SQL.
This definition reports net sales for an order cohort. It is not a cash-flow statement, a profitability calculation or proof of why revenue changed. For a causal question such as “Did our campaign cause the change?”, bring in the relevant attribution design and supporting data rather than treating a plausible explanation as evidence.
Use the existing PostgreSQL reference SQL in an isolated test database with your analyst, then follow the full guide for KPI and filter validation. The downloadable reference contains synthetic data and is not an AskYourDatabase import.
Evaluating BigQuery? Complete the BigQuery connection and query-cost preflight before expanding the conversation. It separates project, identity, location and actual job controls from answer-quality checks.
From approved data to a useful BI evaluation
- Choose the workflow and owner. Start with Desktop for conversational exploration, Dashboard Builder for a repeatable view, or Website Chatbot for an application. Confirm the required plan and product controls before planning a team rollout.
- Prepare a reporting source. Ask the database owner for appropriate network access and a restricted account. Prefer approved reporting tables or views. Follow the connection guide; availability of multiple connectors is not a promise of cross-database joins.
- Add business context. Document the meaning of revenue, customers, valid statuses, relationships and date boundaries. Use documentation and verified SQL examples where supported. Keep evaluation questions separate from the examples you use to configure the assistant.
- Ask, refine and reconcile. Start with a question whose answer an analyst already knows. Change one filter, test an empty period and check a follow-up. Record errors and manual corrections, not just successful demonstrations.
- Promote recurring questions deliberately. Use Dashboard Builder for a stable view. Check refresh behavior, query cost, date filters and actual recipient access before following the dashboard embedding workflow.
Use the text-to-SQL acceptance kit for a fuller evaluation. Record correct answers, unresolved questions, time spent reviewing and database or model costs separately. There is no universal accuracy percentage or promised time saving for every dataset.
For rollout responsibilities and adoption measurement, see the data democratization guide. This page helps you choose the product workflow; that guide covers operating it across a team.
Check where data goes and who can read it
Desktop connects from your machine; hosted Chatbot and Dashboard workflows use server-side connections. Relevant schema, context or query results may still reach the configured model provider. A local connection or private application deployment does not by itself establish offline inference. Review data flow and security and private deployment requirements for your configuration.
Use database permissions and reviewed access controls for reporting restrictions. A prompt saying “read only” is not a permission boundary, and hiding a field from the interface does not prove that the execution identity cannot read it. If warehouse column-level rules are a requirement, test them using the actual connection identity. Do not assume that a shared credential automatically inherits each viewer's warehouse role.
Before sharing, ask a permitted and a forbidden question as distinct test users, inspect backend results and confirm how sessions identify recipients. A working link or a refusal sentence is not enough to certify isolation. The embedded chatbot implementation guide explains that separate integration task.
Connect your stack
Works with your databases
Explore supported data sources and start with the database your team already uses.


Choosing an analysis workflow? Read the SQL Server GUI guide or the MySQL GUI and daily-total checks. You can also compare Snowflake natural language analytics options. For a shareable reporting deliverable, follow the PostgreSQL report workflow and acceptance checks.
Need a sample database? Create one with Neon
AI business intelligence questions
What is AI business intelligence?
AI business intelligence uses AI to help people query, explain or visualize business data. Conversational BI is one approach: users ask questions in natural language. Useful answers still depend on approved data, clear metric definitions and verified results.
Do business users need to write SQL?
AskYourDatabase lets users ask database questions in plain language. An analyst or database owner should prepare access and business context, then validate important answers. Removing SQL from the user interface does not remove the need for data expertise.
Can AskYourDatabase replace Power BI or Tableau?
It depends on the workflow. AskYourDatabase supports conversational database analysis and a separate Dashboard Builder. If your team relies on an existing semantic model, certified reports or established distribution controls, evaluate that BI platform's AI features first. This page does not promise automatic migration of reports or metric definitions.
Can I ask questions across PostgreSQL and BigQuery?
Both are supported database types. Support for multiple connectors does not establish a federated join across separate systems. Prepare the required combined reporting data in a supported source, or evaluate each source separately with its own definitions and permissions.
Does a local database connection keep all data offline?
No. Desktop connects from your machine, but relevant context or query results can still be sent to the configured AI provider. Hosted products use server-side connections. Private hosting requires a separate review of model endpoints, network paths, storage and retention.
Is AI BI free to use?
Check the current AskYourDatabase pricing page for available plans, allowances and billing terms. Compare Desktop, Website Chatbot and Enterprise requirements, and confirm Dashboard Builder availability for your intended use. Include database compute, model usage and review time in your evaluation; this page does not promise an unlimited free service.
Bring one business question and a known answer
Start an evaluation with approved data, a clear metric definition and an analyst who can check the result. Choose the deployment and plan that fit your team.
Product workflow and example reviewed October 12, 2026.